Monitoring
Monitoring
Monitoring
Digital Advertising Platform Modernization
Digital Advertising Platform Modernization
Digital Advertising Platform Modernization
Digital Advertising Platform Modernization

CONTEXT
CONTEXT
CONTEXT
The Need for Modernization
The Need for Modernization
The Need for Modernization
The Digital Marketing Platform Modernization Project emerged as a strategic response to an outdated demand-side platform (DSP) that had become a collection of fragmented, managed-service tools. Over time, this patchwork approach led to inefficiencies—from duplicated data entry to inconsistent user experiences across separate applications.
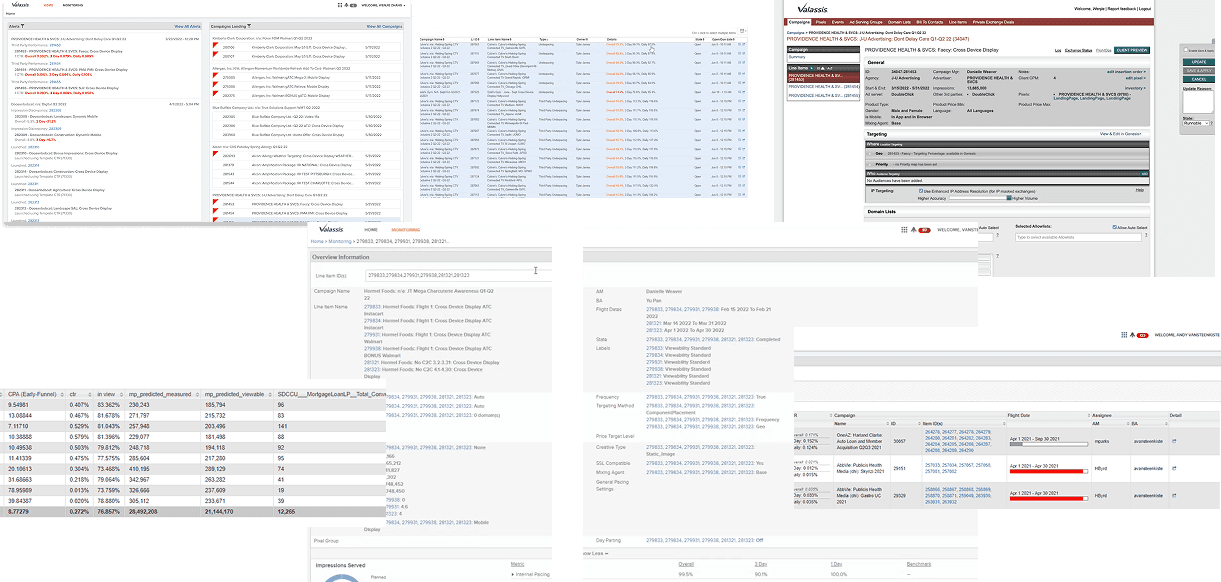
Previously System: Too many tools, too many manual steps
This multi-phase initiative envisions consolidating everything from planning and execution to reporting under one cohesive platform. By revitalizing legacy systems and aligning them with user needs, This Project not only reduces operational overhead but also opens up new revenue opportunities.
A Unified Solution: Streamlining into One Cohesive Platform
*Drag ←→ to view Before & After
A Unified Solution: Streamlining into One Cohesive Platform
*Drag ←→ to view Before & After
A Unified Solution: Streamlining into One Cohesive Platform
*Drag ←→ to view Before & After
The Digital Marketing Platform Modernization Project( internally known as Quattro) emerged as a strategic response to an outdated demand-side platform (DSP) that had become a collection of fragmented, managed-service tools. Over time, this patchwork approach led to inefficiencies—from duplicated data entry to inconsistent user experiences across separate applications.
This multi-phase initiative envisions consolidating everything from planning and execution to reporting under one cohesive platform. By revitalizing legacy systems and aligning them with user needs, Project Quattro not only reduces operational overhead but also opens up new revenue opportunities.
A Unified Solution: Streamlining into One Cohesive Platform
*Drag ←→ to view Before & After
Previously System: Too many tools, too many manual steps
PROBLEMS
Legacy Performance Tacking Systems Plagued by Inefficiencies
Legacy Performance Tacking Systems Plagued by Inefficiencies
Legacy Performance Tacking Systems Plagued by Inefficiencies
The ability for CMs and BAs to effectively monitor campaigns is significantly hindered by system's outdated design, performance issues, and lack of user-centric functionality.
The ability for CMs and BAs to effectively monitor campaigns is significantly hindered by system's outdated design, performance issues, and lack of user-centric functionality.
• Unreliable & Fragmented Data – No single source of truth, inconsistent visibility, and reliance on workarounds for accuracy.
• Inefficient & Cumbersome Workflow – Slow performance, tedious navigation, and lack of quick-access insights.
• Poor Usability & Lack of User-Centric Design – Cluttered interface, ineffective filtering, and misalignment with the campaign lifecycle.
• Communication Overload & Lack of Centralization – Scattered campaign data across multiple tools, making it difficult to get a comprehensive, at-a-glance view.
Establishing Monitoring to Drive Business Impact & Efficiency
Monitoring was prioritized as the first phase of the initiative to address critical inefficiencies in the outdated tracking system. By creating a single source of truth, the new monitoring system reduces operational workload, enables proactive issue detection, and provides clear, real-time insights for campaign managers to optimize performance. It also lays the groundwork for self-service DSP capabilities, allowing external agencies to track and adjust campaigns independently, unlocking new revenue opportunities. Monitoring system ensures workflow automation, cost reduction, and long-term scalability, strengthening our competitive position in the market.
Monitoring was prioritized as the first phase of the initiative to address critical inefficiencies in the outdated tracking system. By creating a single source of truth, the new monitoring system reduces operational workload, enables proactive issue detection, and provides clear, real-time insights for campaign managers to optimize performance. It also lays the groundwork for self-service DSP capabilities, allowing external agencies to track and adjust campaigns independently, unlocking new revenue opportunities. Monitoring system ensures workflow automation, cost reduction, and long-term scalability, strengthening our competitive position in the market.
Monitoring was prioritized as the first phase of the initiative to address critical inefficiencies in the outdated tracking system. By creating a single source of truth, the new monitoring system reduces operational workload, enables proactive issue detection, and provides clear, real-time insights for campaign managers to optimize performance. It also lays the groundwork for self-service DSP capabilities, allowing external agencies to track and adjust campaigns independently, unlocking new revenue opportunities. Monitoring system ensures workflow automation, cost reduction, and long-term scalability, strengthening our competitive position in the market.
Monitoring was prioritized as the first phase of the initiative to address critical inefficiencies in the outdated tracking system. By creating a single source of truth, the new monitoring system reduces operational workload, enables proactive issue detection, and provides clear, real-time insights for campaign managers to optimize performance. It also lays the groundwork for self-service DSP capabilities, allowing external agencies to track and adjust campaigns independently, unlocking new revenue opportunities. Monitoring system ensures workflow automation, cost reduction, and long-term scalability, strengthening our competitive position in the market.


CHALLENGE
Drove strategy - Identify issue and propose ideas
Drove strategy - Identify issue and propose ideas
Drove strategy - Identify issue and propose ideas
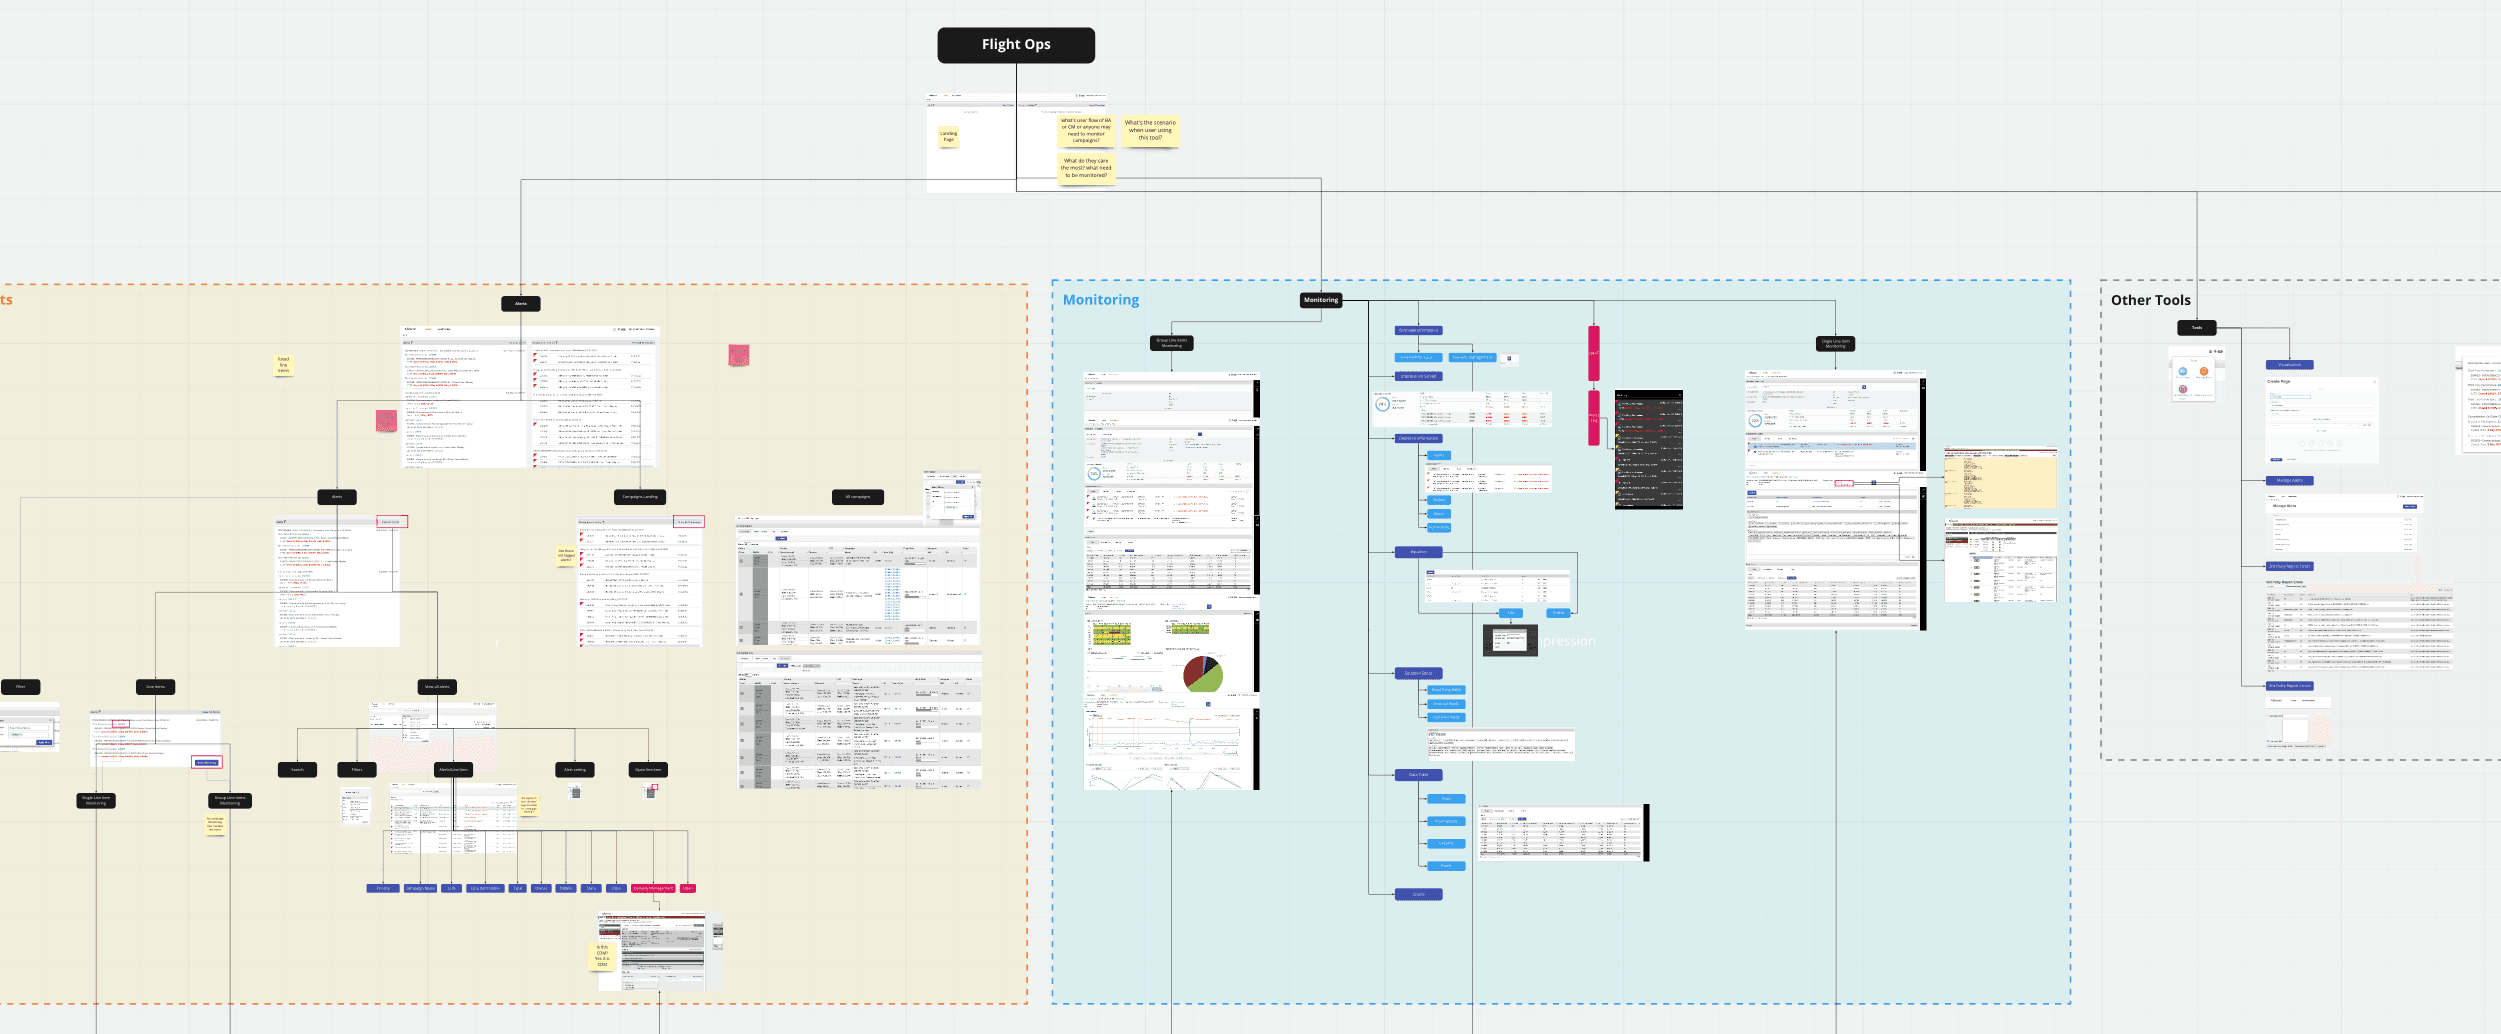
The Quattro Monitoring project was not initially part of the product roadmap—it was a UX-led initiative driven by the recognition of severe usability gaps across the system especially FlightOps. As a key advocate, I identified the inefficient workflows, fragmented data, and performance bottlenecks that were significantly impacting campaign managers and business analysts. Instead of waiting for a directive.
The Quattro Monitoring project was not initially part of the product roadmap—it was a UX-led initiative driven by the recognition of severe usability gaps across the system especially FlightOps. As a key advocate, I identified the inefficient workflows, fragmented data, and performance bottlenecks that were significantly impacting campaign managers and business analysts. Instead of waiting for a directive.
The Quattro Monitoring project was not initially part of the product roadmap—it was a UX-led initiative driven by the recognition of severe usability gaps across the system especially FlightOps. As a key advocate, I identified the inefficient workflows, fragmented data, and performance bottlenecks that were significantly impacting campaign managers and business analysts. Instead of waiting for a directive.
The Quattro Monitoring project was not initially part of the product roadmap—it was a UX-led initiative driven by the recognition of severe usability gaps across the system especially FlightOps. As a key advocate, I identified the inefficient workflows, fragmented data, and performance bottlenecks that were significantly impacting campaign managers and business analysts. Instead of waiting for a directive.
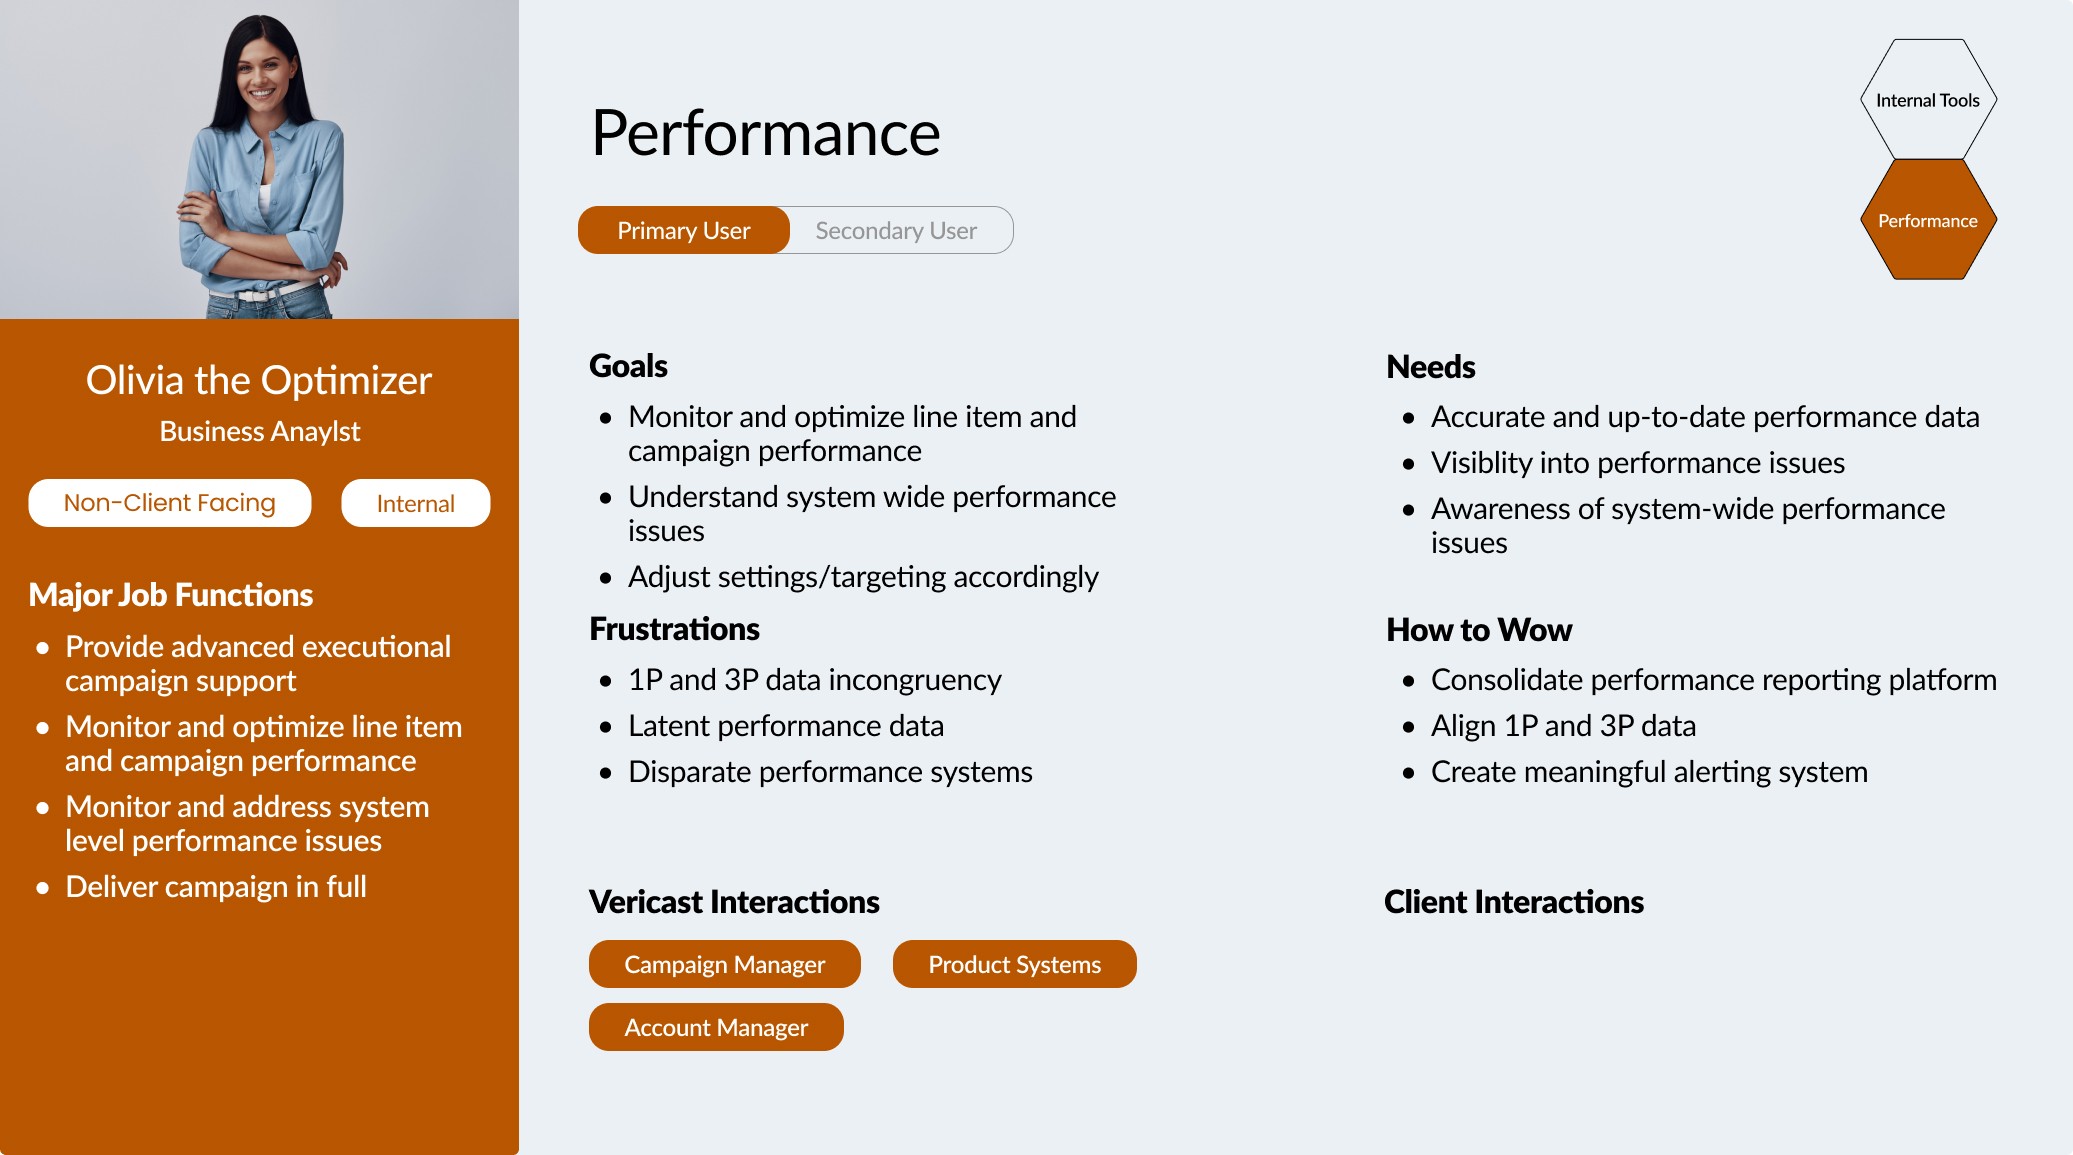
Our Users
Our primary users include Business Analysts, Campaign Managers, and Account Managers, along with potential external agency partners who may leverage the platform for campaign monitoring and optimization.
Our primary users include Business Analysts, Campaign Managers, and Account Managers, along with potential external agency partners who may leverage the platform for campaign monitoring and optimization.
Our primary users include Business Analysts, Campaign Managers, and Account Managers, along with potential external agency partners who may leverage the platform for campaign monitoring and optimization.
Our primary users include Business Analysts, Campaign Managers, and Account Managers, along with potential external agency partners who may leverage the platform for campaign monitoring and optimization.


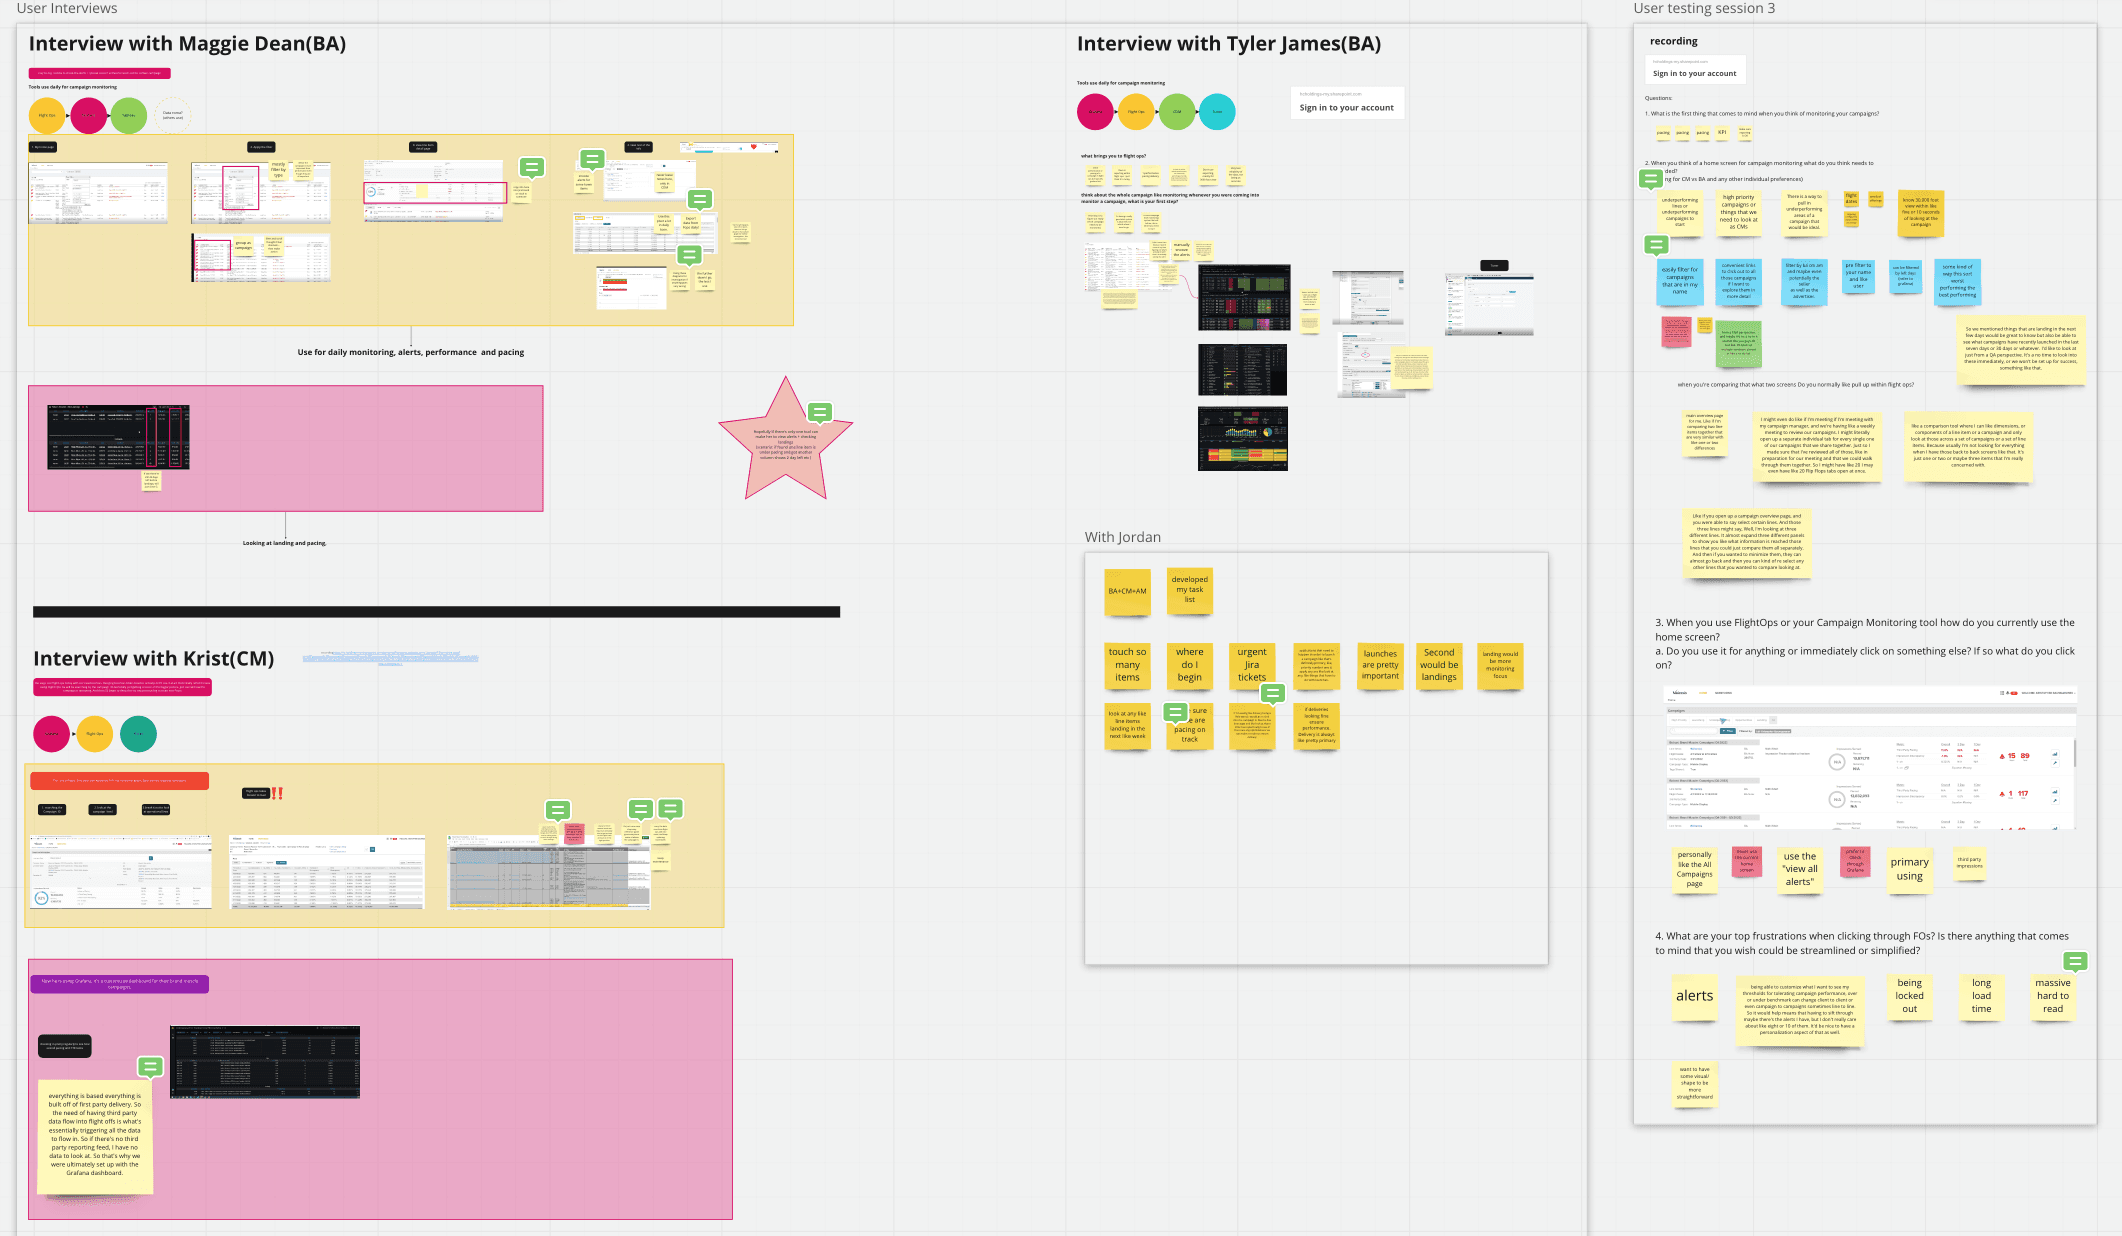
Start as a "Product Manager"
With minimal guidance from the product team, we initiated user research, mapped pain points, and proposed a design approach to streamline monitoring. I took ownership—defining problem statements, writing user stories, and creating product tickets to highlight the urgent need for a modern monitoring system.I put myself in a Product Manager’s shoes, thinking beyond design to business impact and long-term scalability.
With minimal guidance from the product team, we initiated user research, mapped pain points, and proposed a design approach to streamline monitoring. I took ownership—defining problem statements, writing user stories, and creating product tickets to highlight the urgent need for a modern monitoring system.I put myself in a Product Manager’s shoes, thinking beyond design to business impact and long-term scalability.
With minimal guidance from the product team, we initiated user research, mapped pain points, and proposed a design approach to streamline monitoring. I took ownership—defining problem statements, writing user stories, and creating product tickets to highlight the urgent need for a modern monitoring system.I put myself in a Product Manager’s shoes, thinking beyond design to business impact and long-term scalability.
With minimal guidance from the product team, we initiated user research, mapped pain points, and proposed a design approach to streamline monitoring. I took ownership—defining problem statements, writing user stories, and creating product tickets to highlight the urgent need for a modern monitoring system.I put myself in a Product Manager’s shoes, thinking beyond design to business impact and long-term scalability.

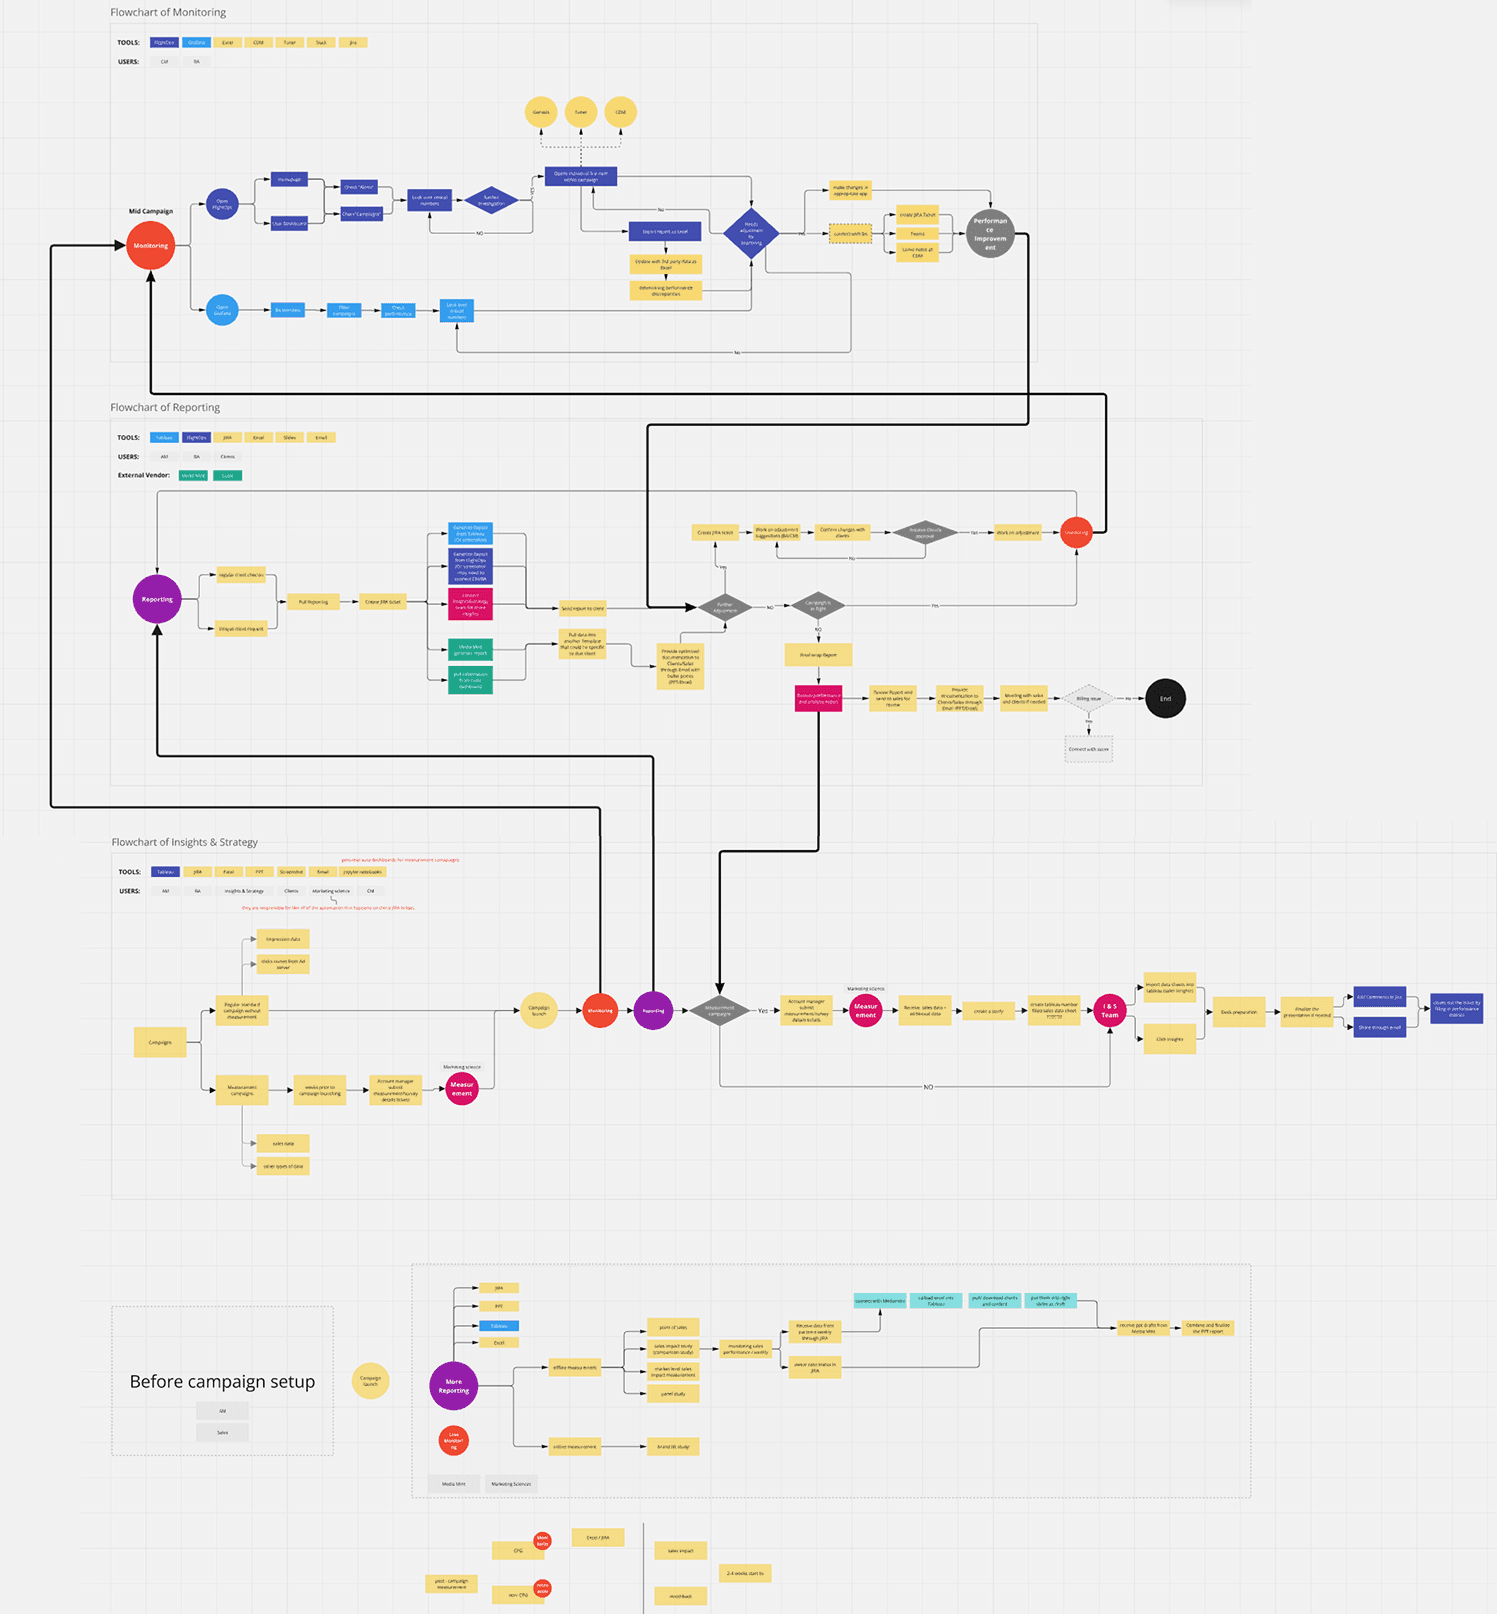
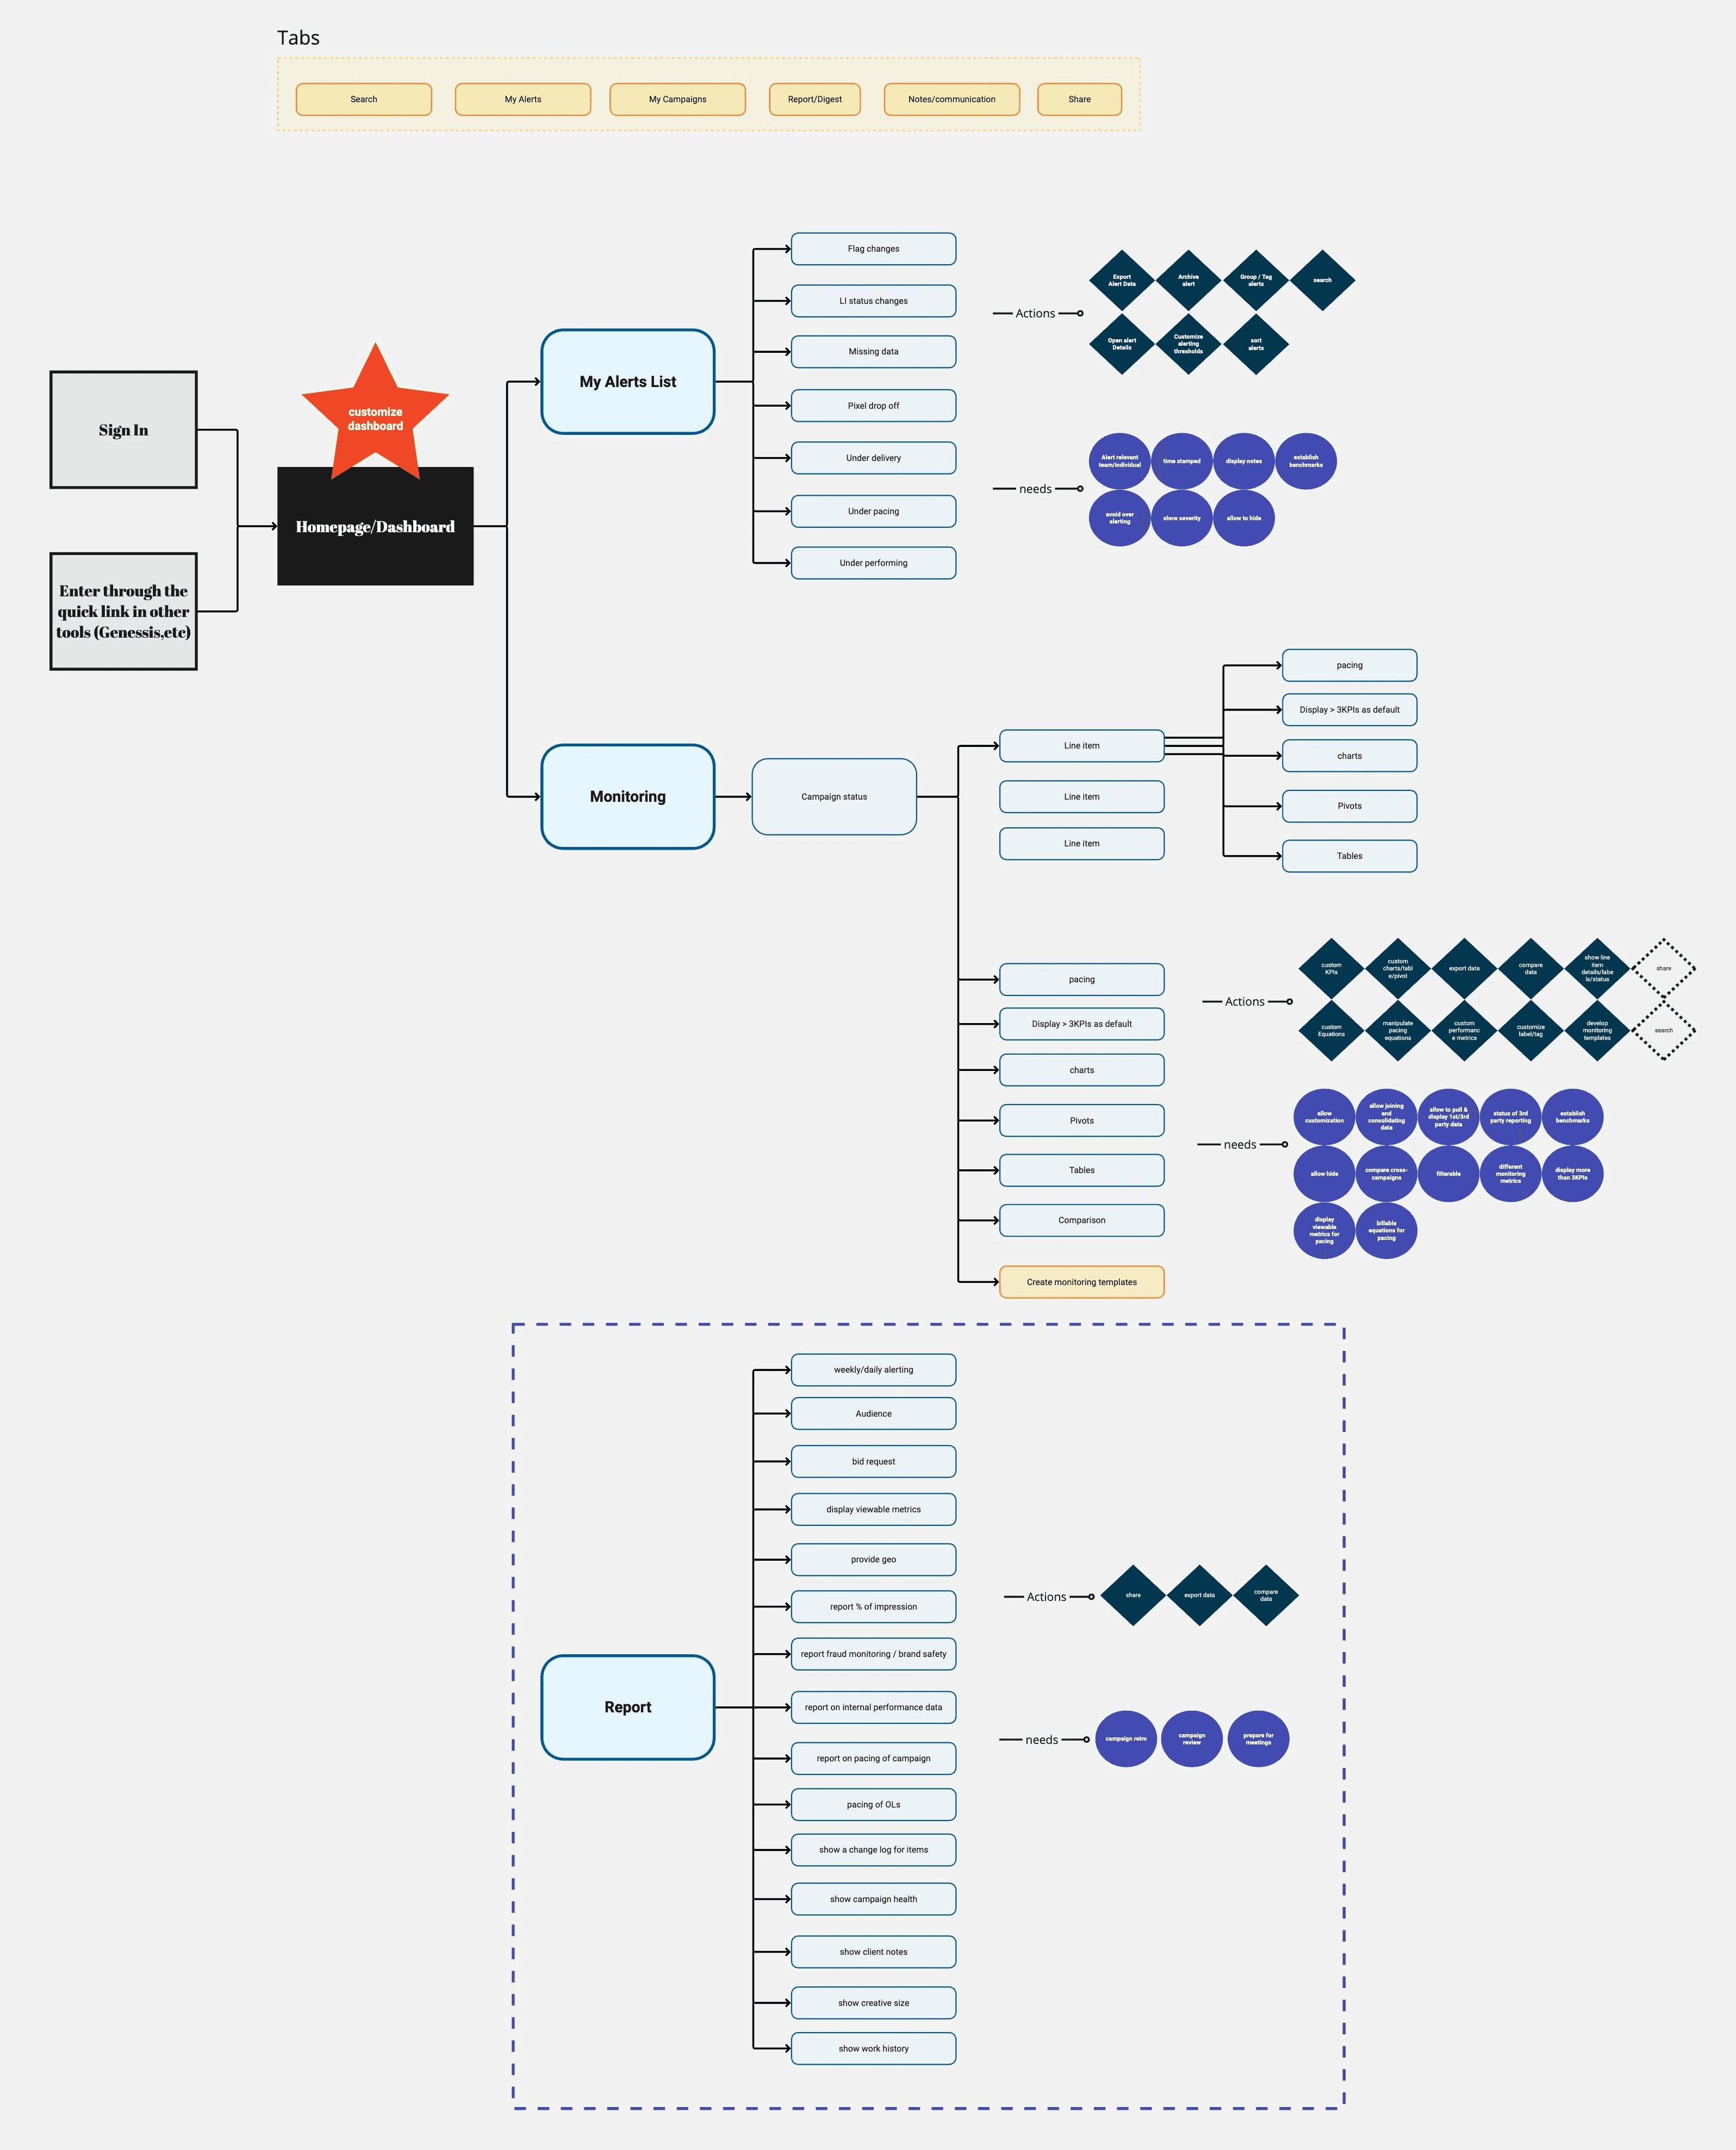
Through independent problem-solving and strategic thinking, I developed a robust Information Architecture vision and iterated on potential solutions. This was particularly challenging due to the legacy system’s complex hierarchy—spanning Client → Advertiser → Campaign → Client Line Item → Line Item → multiple Channels & KPIs.

Once we had a clear research-backed proposal, I pitched the concept to leadership, demonstrating how an improved monitoring system would increase operational efficiency, reduce manual workload, and enable self-service capabilities. My persistence paid off—what started as a UX-driven effort gained executive buy-in, leading to prioritization on the product roadmap. This initiative set a precedent for UX’s role in driving product strategy and innovation.
Once we had a clear research-backed proposal, I pitched the concept to leadership, demonstrating how an improved monitoring system would increase operational efficiency, reduce manual workload, and enable self-service capabilities. My persistence paid off—what started as a UX-driven effort gained executive buy-in, leading to prioritization on the product roadmap. This initiative set a precedent for UX’s role in driving product strategy and innovation.
Once we had a clear research-backed proposal, I pitched the concept to leadership, demonstrating how an improved monitoring system would increase operational efficiency, reduce manual workload, and enable self-service capabilities. My persistence paid off—what started as a UX-driven effort gained executive buy-in, leading to prioritization on the product roadmap. This initiative set a precedent for UX’s role in driving product strategy and innovation.
Once we had a clear research-backed proposal, I pitched the concept to leadership, demonstrating how an improved monitoring system would increase operational efficiency, reduce manual workload, and enable self-service capabilities. My persistence paid off—what started as a UX-driven effort gained executive buy-in, leading to prioritization on the product roadmap. This initiative set a precedent for UX’s role in driving product strategy and innovation.
SOLUTION IN PROGRESS
Collaborating Across Teams to Launch Monitoring in Phases
Collaborating Across Teams to Launch Monitoring in Phases
Collaborating Across Teams to Launch Monitoring in Phases
With product team officially in place, we could finally move forward with a structured roadmap, prioritizing monitoring in phased development due to the complexity of legacy data architecture and limited engineering resources. Given these constraints, we focused on delivering immediate impact while aligning with the long-term vision of an integrated platform.
With product team officially in place, we could finally move forward with a structured roadmap, prioritizing monitoring in phased development due to the complexity of legacy data architecture and limited engineering resources. Given these constraints, we focused on delivering immediate impact while aligning with the long-term vision of an integrated platform.
With product team officially in place, we could finally move forward with a structured roadmap, prioritizing monitoring in phased development due to the complexity of legacy data architecture and limited engineering resources. Given these constraints, we focused on delivering immediate impact while aligning with the long-term vision of an integrated platform.
With product team officially in place, we could finally move forward with a structured roadmap, prioritizing monitoring in phased development due to the complexity of legacy data architecture and limited engineering resources. Given these constraints, we focused on delivering immediate impact while aligning with the long-term vision of an integrated platform.
To tackle key user pain points, I collaborated with product, engineering, and data teams to refine stage-one requirements, improving navigation, hierarchy, and workflows. This phased approach balanced business goals with engineering feasibility, ensuring continuous value delivery.

One of the Challenges
Effectively Presenting KPIs Across Data Sources in a Complex Hierarchy
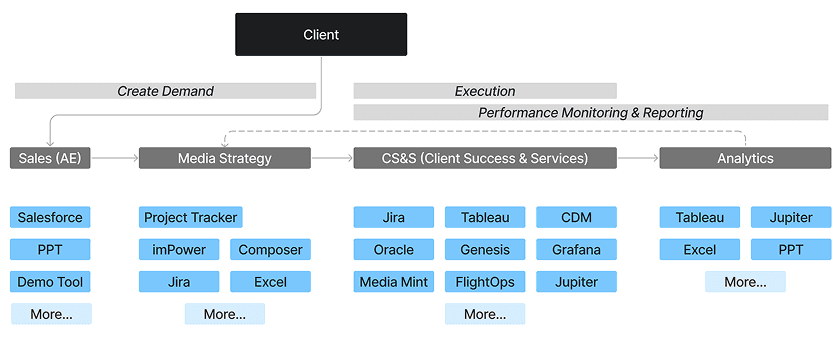
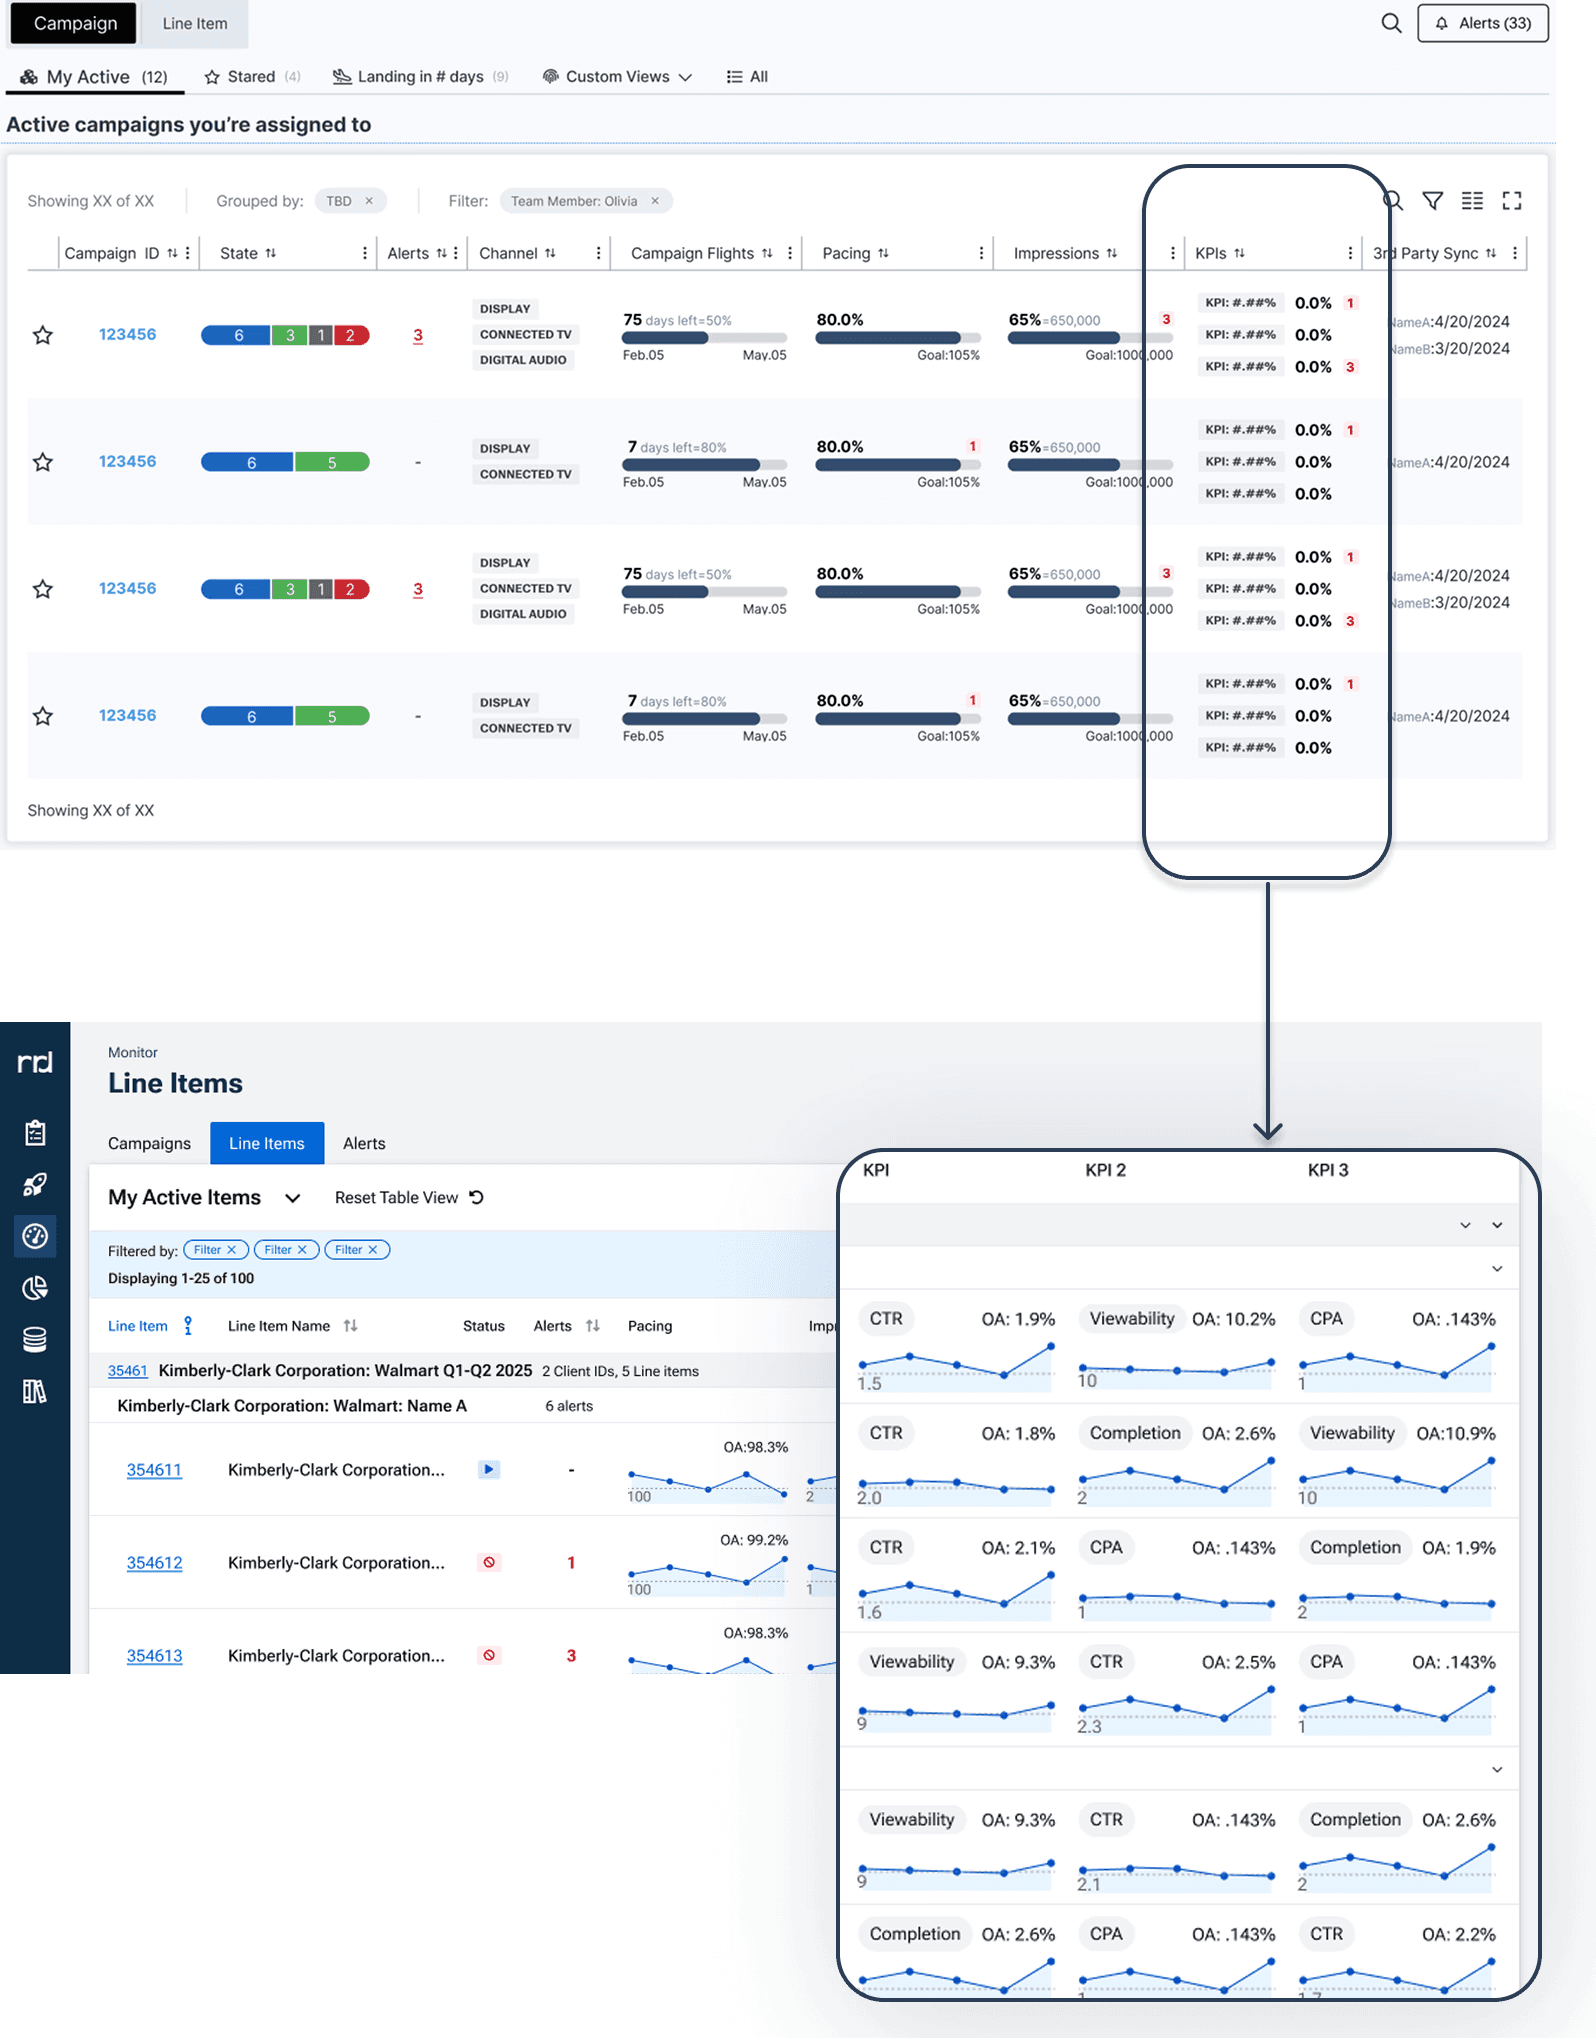
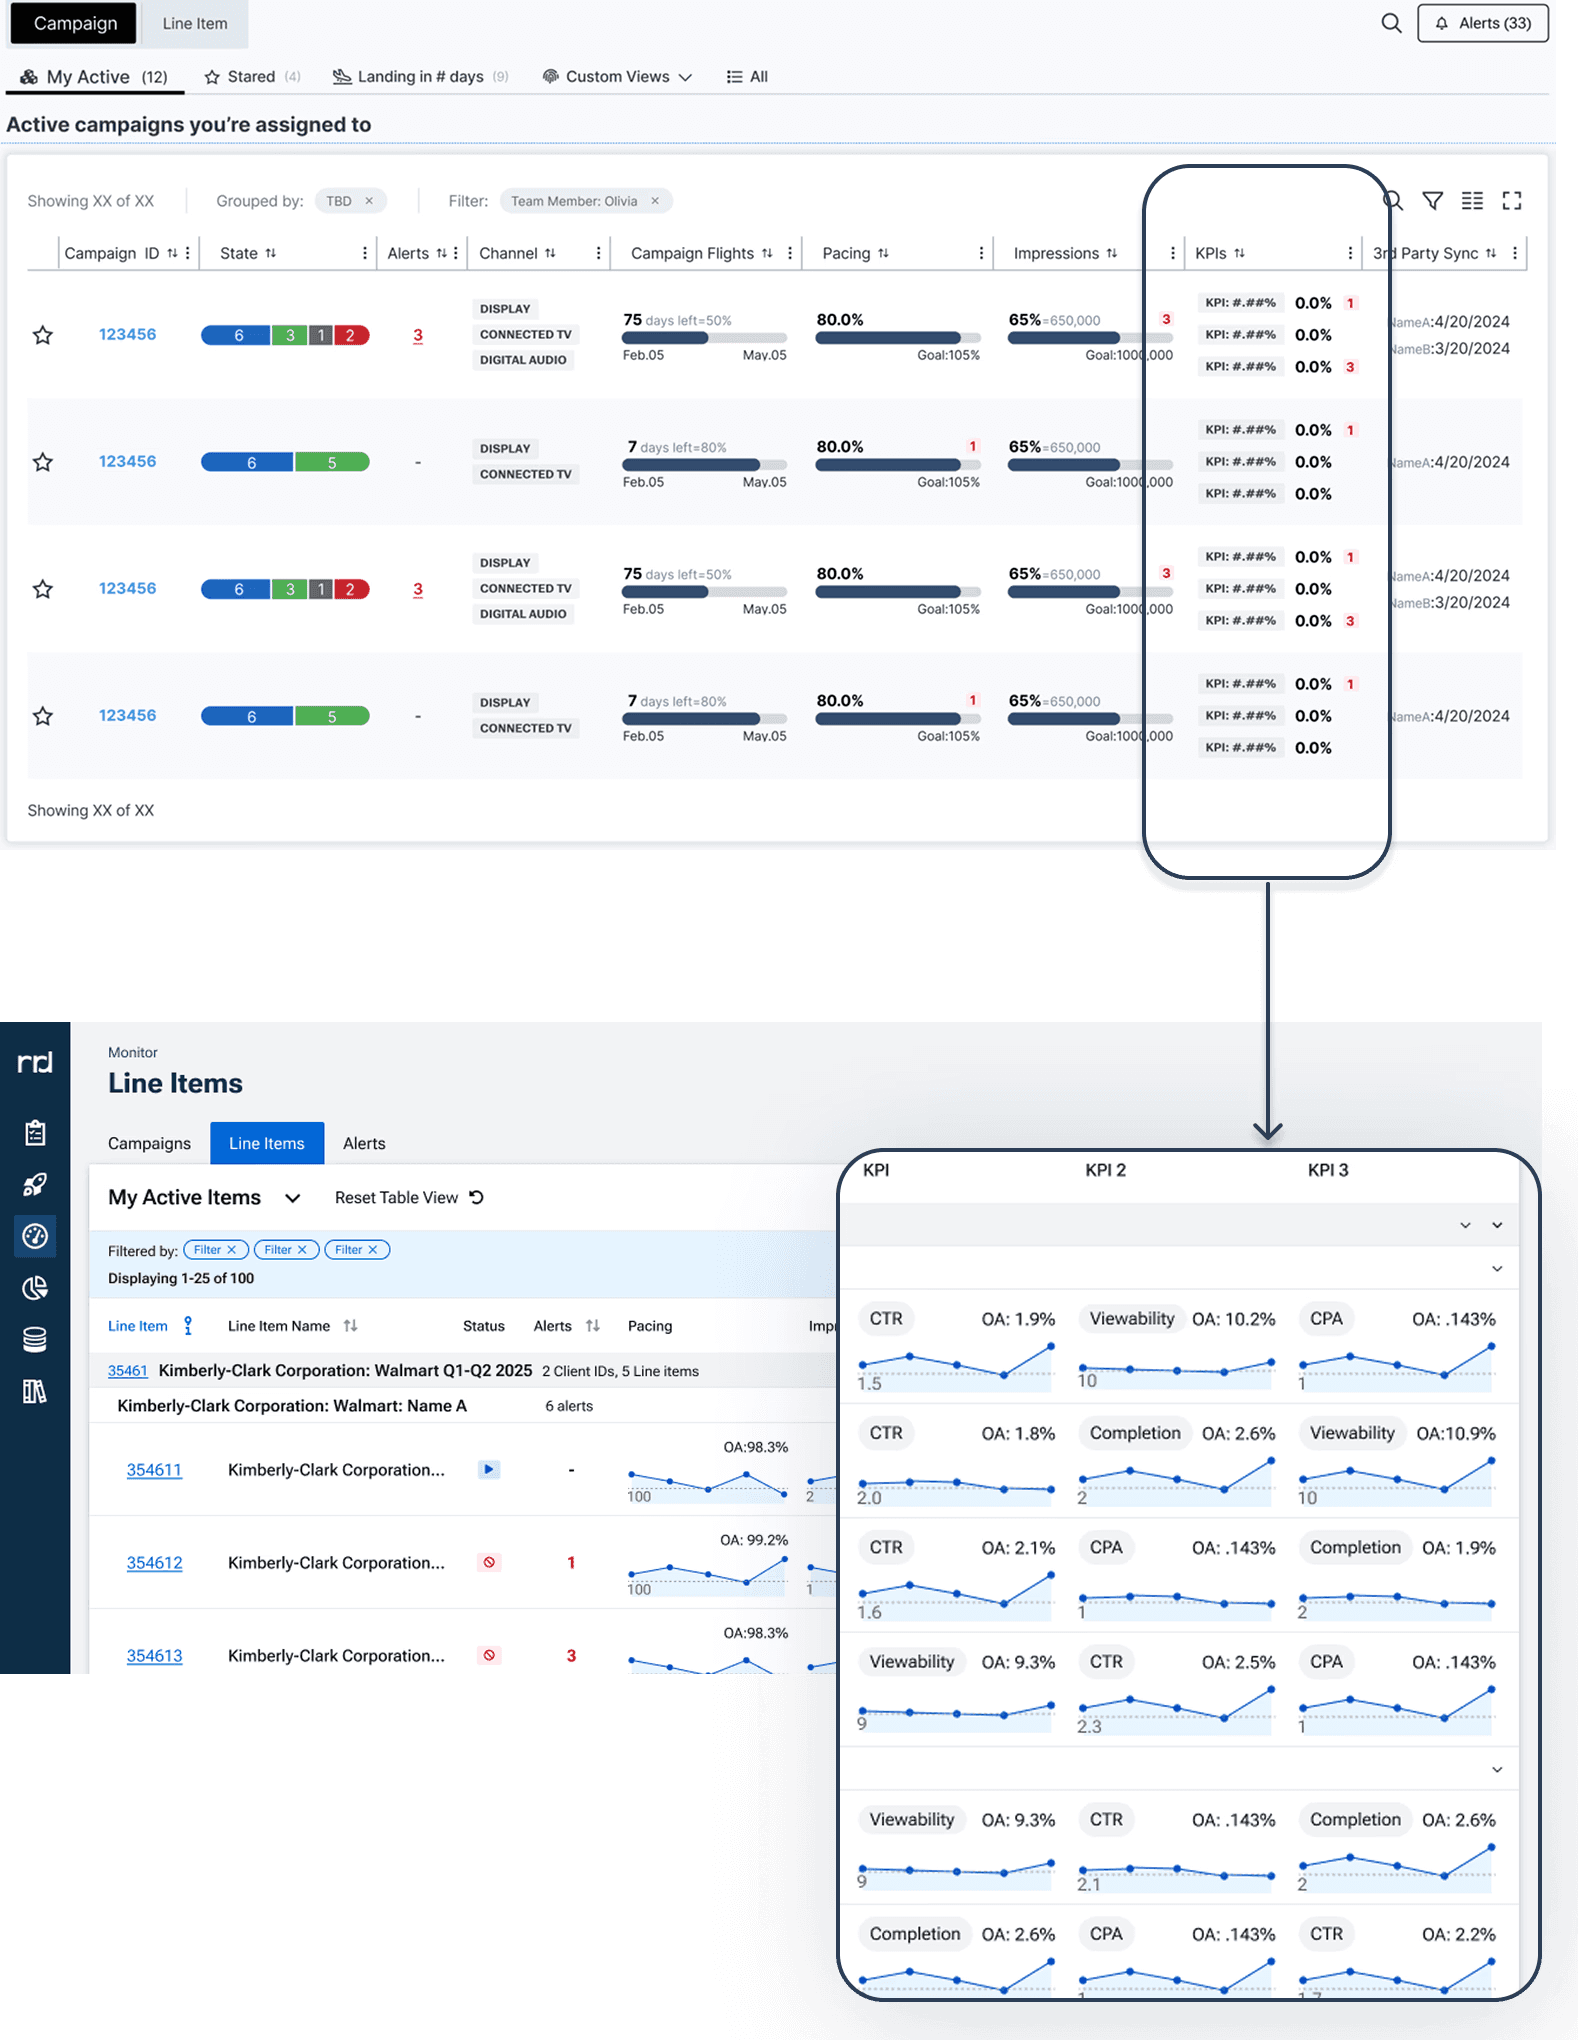
This diagram showcases the complex hierarchy of digital advertising campaigns, where client budgets are distributed across multiple channels—Connected TV, Display, Social, and more. Each campaign breaks down into client line items, further subdivided into individual line items with unique KPIs. These KPIs are sourced from both internal data and third-party vendors, adding extra layer of complexity. Presenting significant challenges in data organization and visualization.

Initially, we aimed to show the top three KPIs at the campaign level for a high-level performance summary, but after multiple discussions and testing with data engineering, we faced backend constraints that led to long load times and technical overhead. Despite its user benefits, we had to archive this feature for now.
To find a balance, I proposed two alternatives:
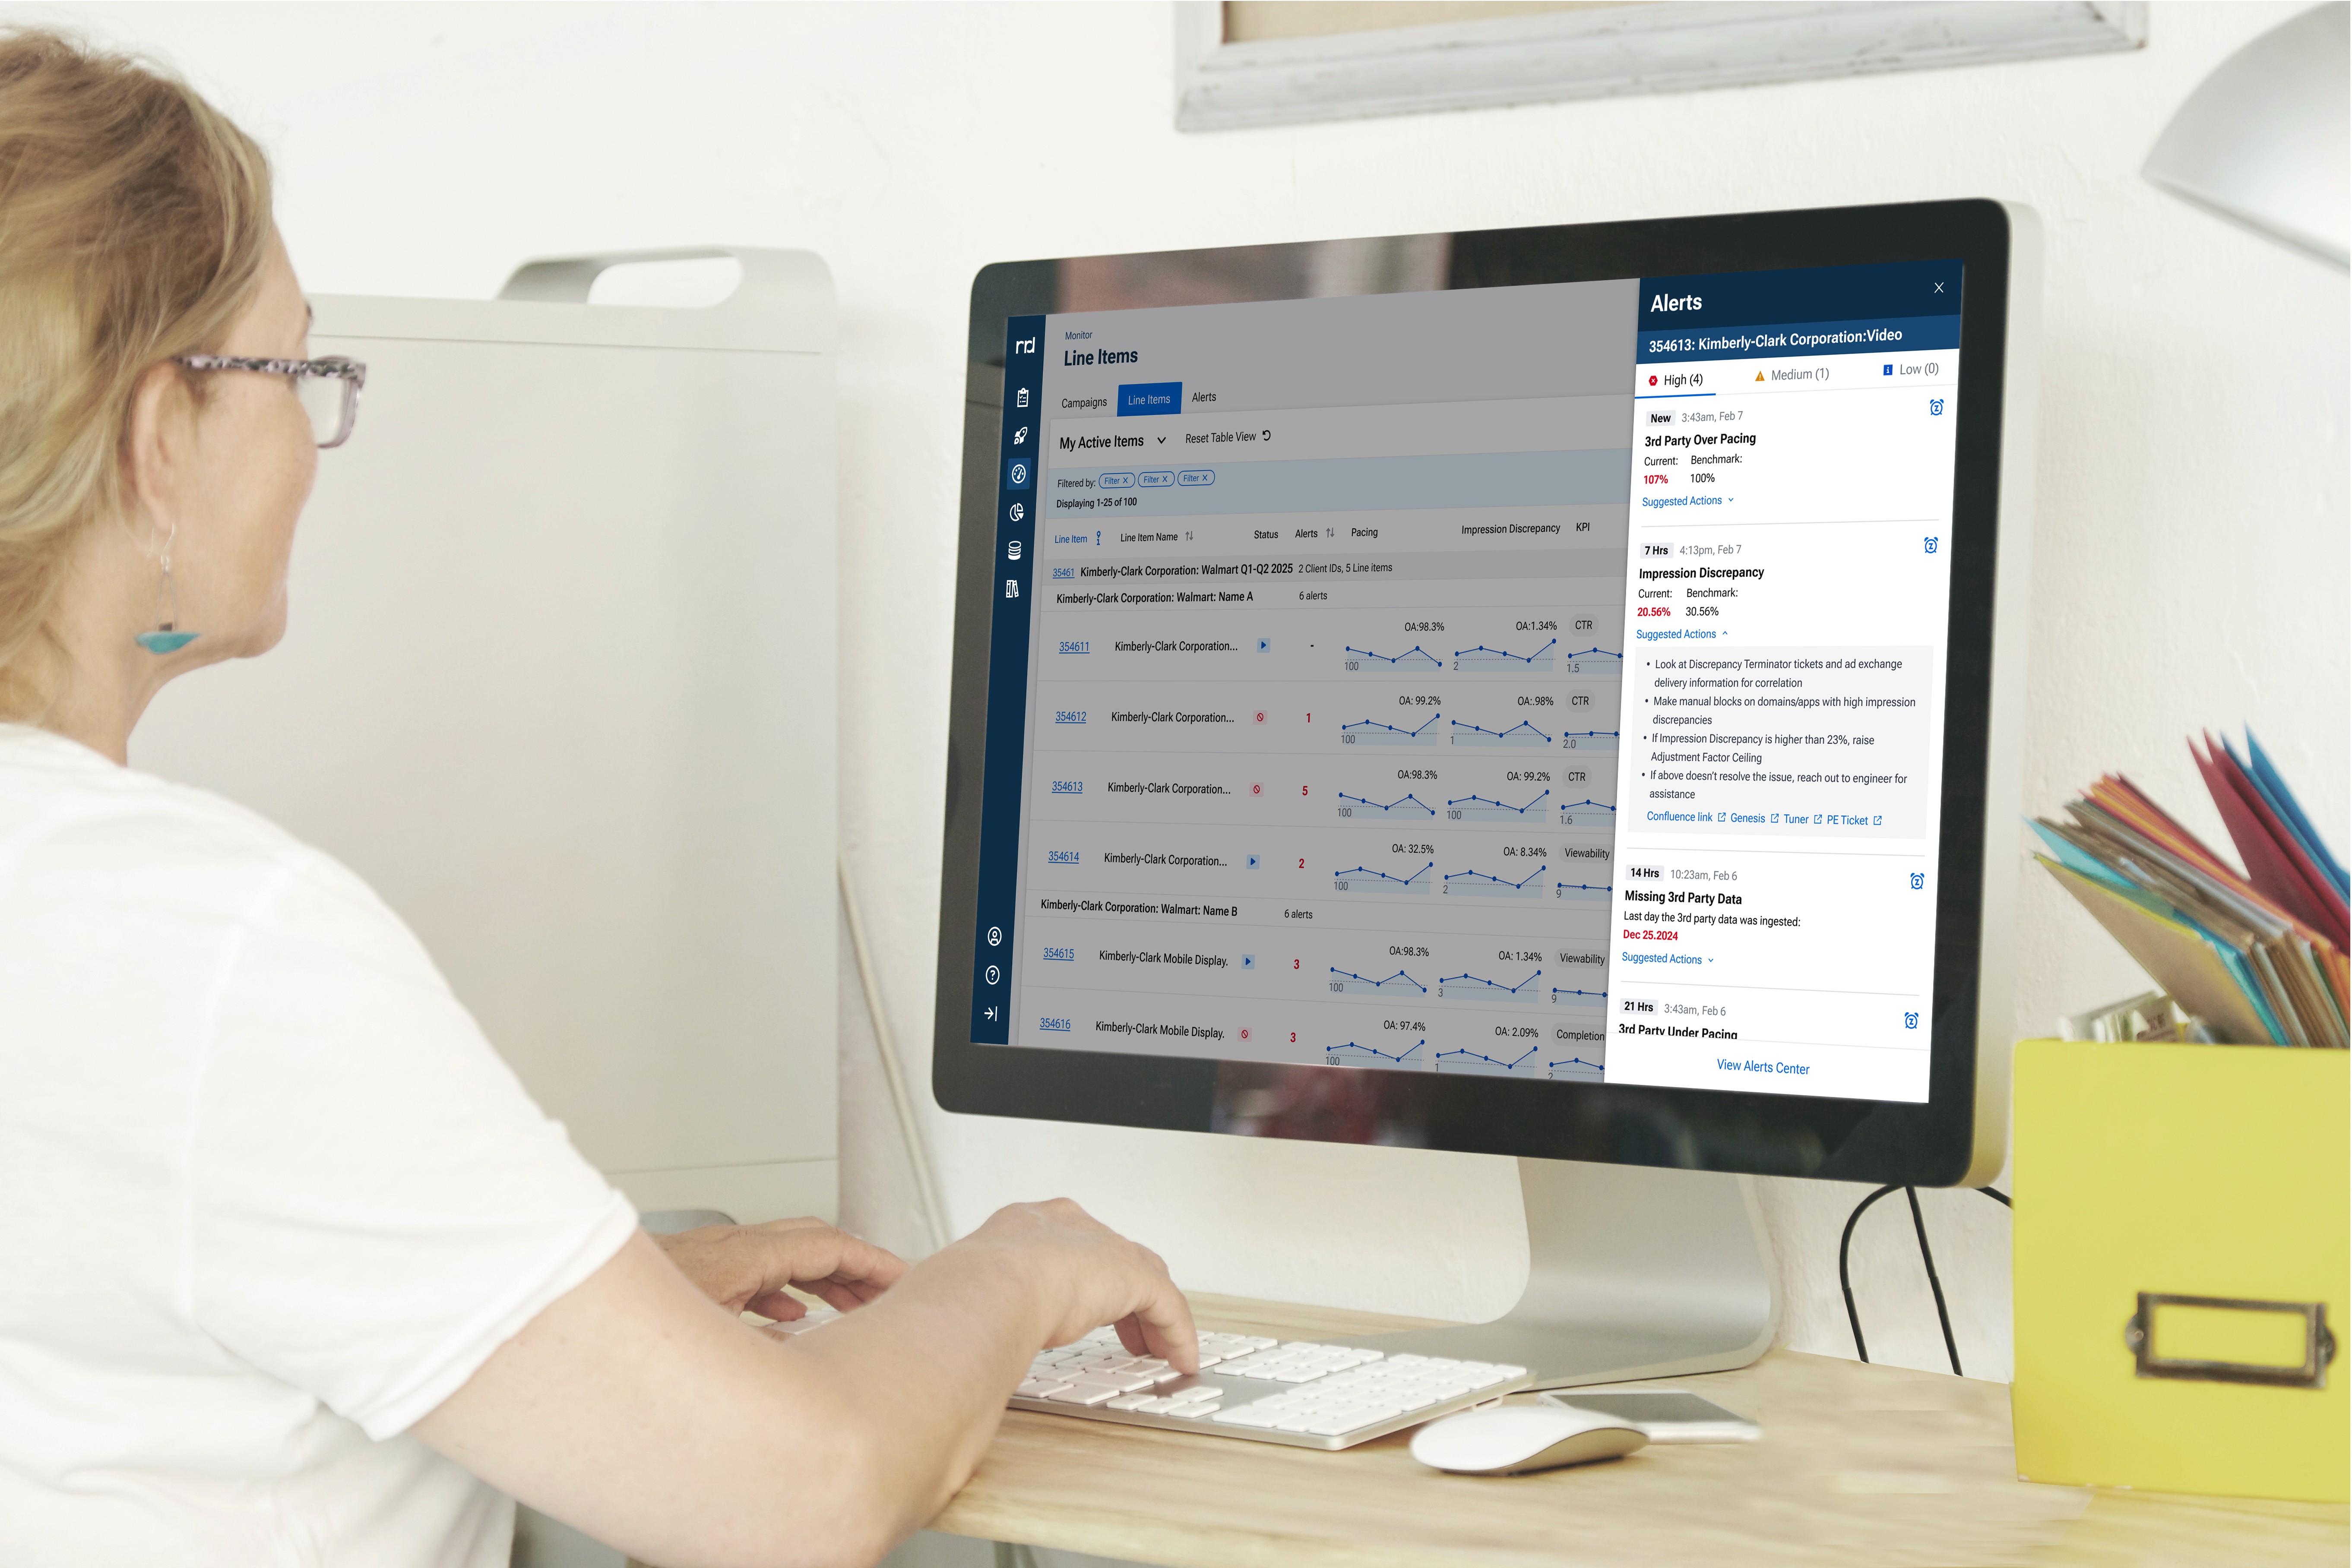
- Showing the top three KPIs as spark lines at the line item level, providing trend insights while keeping data processing manageable. This solution saved users significant time, eliminating the need to manually open multiple tabs and check line items individually.
- A grouping-by-channel approach, allowing users to see high-level KPI performance without straining the backend, planned for a later phase.

This diagram showcases the complex hierarchy of digital advertising campaigns, where client budgets are distributed across multiple channels—Connected TV, Display, Social, and more. Each campaign breaks down into client line items, further subdivided into individual line items with unique KPIs. These KPIs are sourced from both internal data and third-party vendors, adding extra layer of complexity. Presenting significant challenges in data organization and visualization.
Initially, we aimed to show the top three KPIs at the campaign level for a high-level performance summary, but after multiple discussions and testing with data engineering, we faced backend constraints that led to long load times and technical overhead. Despite its user benefits, we had to archive this feature for now.
To find a balance, I proposed two alternatives:
- Showing the top three KPIs as spark lines at the line item level, providing trend insights while keeping data processing manageable. This solution saved users significant time, eliminating the need to manually open multiple tabs and check line items individually.
- A grouping-by-channel approach, allowing users to see high-level KPI performance without straining the backend, planned for a later phase.

This diagram showcases the complex hierarchy of digital advertising campaigns, where client budgets are distributed across multiple channels—Connected TV, Display, Social, and more. Each campaign breaks down into client line items, further subdivided into individual line items with unique KPIs. These KPIs are sourced from both internal data and third-party vendors, adding extra layer of complexity. Presenting significant challenges in data organization and visualization.
NEXT STEPS
Advancing Monitoring in Phases
With Performance Monitoring 1.0 replacing FlightOps, the next phases will enhance usability, expand data visibility, and introduce automation to fully transition away from legacy systems. Throughout this process, I have worked closely with cross-functional teams, continuously collaborating, iterating, and challenging each other to refine solutions.
Monitoring 2.0: Expanding Capabilities
This phase enhances filtering, exporting, and data insights to improve campaign tracking:
Deeper insights into allowlists, blocklists, and PMP deals.
Improved filtering & exports for historical data and campaign views.
Granular performance tracking for contextual targeting and audience delivery.
Streamlined activity logs for better accessibility.
Monitoring 3.0: Personalization & Automation
The final phase focuses on customization and automation:
Saved Views & Filters for personalized tracking.
Pixel Data Tracking for better performance insights.
Automated alerts & recommendations for proactive optimizations.
Monitoring 3.0: Personalization & Automation
The final phase focuses on customization and automation:
Saved Views & Filters for personalized tracking.
Pixel Data Tracking for better performance insights.
Automated alerts & recommendations for proactive optimizations.
Monitoring 3.0: Personalization & Automation
The final phase focuses on customization and automation:
Saved Views & Filters for personalized tracking.
Pixel Data Tracking for better performance insights.
Automated alerts & recommendations for proactive optimizations.

This project remains an ongoing initiative, and I will continue refining the design and user experience through iterations based on user feedback and evolving business needs, ensuring that monitoring becomes a powerful, intuitive, and scalable solution for campaign tracking.
BEYOND MONITORING
Designing Quattro’s Alerting System
While advancing Monitoring, I have also been tackling Quattro’s next major challenge—the Alerting System. Monitoring provides visibility, but without proactive alerts, users must manually track issues, leading to delays and inefficiencies.
The Alerting System ensures users receive timely, actionable notifications to improve response times and campaign performance. This project comes with its own unique challenges, and I’m excited to share how I approached them.
👉 Check out my next case study on Quattro’s Alerting System 🚀